

A plant can use less electricity in a month while using more electricity for every unit it produces.
That is a useful question for a monthly operations meeting. The electricity total has fallen, but output has changed too. Before describing the result as progress, compare consumption with a consistently defined energy intensity measure.
The Energy & Sustainability KPI Dashboard for Excel provides a structure for a manually maintained, 12-month actual-versus-target review. Consumption and intensity are among its published default KPIs. A practical starting point is to prepare both measures carefully, then bring the validated monthly values into the review.
An Illustrative Energy Intensity Review
Illustrative example: fictional figures, not client data or a product result. Consider one plant reporting electricity only. Both months use the same reporting boundary, month cutoffs and defined unit of production.
Energy intensity expresses energy use per production unit; the US EPA’s Lean & Energy Toolkit lists that measure alongside electricity consumption in kilowatt-hours. Here, the chosen ratio is electricity consumed divided by defined output units.
| Measure | Month A | Month B |
|---|---|---|
| Electricity consumption | 100,000 kWh | 90,000 kWh |
| Defined output units | 10,000 | 7,500 |
| Electricity per output unit | 10 kWh/unit | 12 kWh/unit |
The calculations are 100,000 / 10,000 = 10 and 90,000 / 7,500 = 12. Electricity consumption falls 10%, while the simple intensity ratio rises 20%. The two measures answer different questions.
Agree whether an output unit means a finished item, tonne or another defined quantity, and use the same choice in both months. Check that electricity and output cover the same area and time window. A changed definition should prompt a comparability check before the ratio enters a leadership presentation.
Before interpreting that difference, check source completeness and the denominator. Then ask what operating or reporting context needs investigation. The arithmetic alone identifies neither a cause nor verified savings.
Bring Validated KPIs Into the Monthly Review
Use a deliberate sequence to connect the example with the template’s published workflow:
- Agree the measure. Name the source owner and confirm boundaries, units, output definition and monthly cutoffs. Keep an electricity-only measure distinct from any all-fuel total-energy measure.
- Review the sample. Read the Quick Start Guide, inspect the populated workbook and begin the team’s reporting file with the blank workbook.
- Set the relevant fields. Configure KPI names, units, direction, definitions and locally appropriate targets. For this example, identify the intensity explicitly as electricity per defined output unit.
- Prepare and enter values. Calculate and validate intensity in the team’s approved source preparation, outside the reporting template. Manually enter the resulting monthly KPI actuals, targets and relevant prior-period values following the guidance.
- Review and follow up. Read the Executive Dashboard and KPI Trends together. Record the investigation question and owner in the team’s existing action process.
This gives the meeting a prepared comparison. The team remains responsible for its inputs, calculations, targets and interpretation. To inspect the published workflow and buying options, View the dashboard and choose your licence.
Keep the source calculation and target rationale available to the reviewer. If a value is corrected, reconcile the reporting copy with the approved source before using its trend in the next meeting.
What the Excel Package Includes
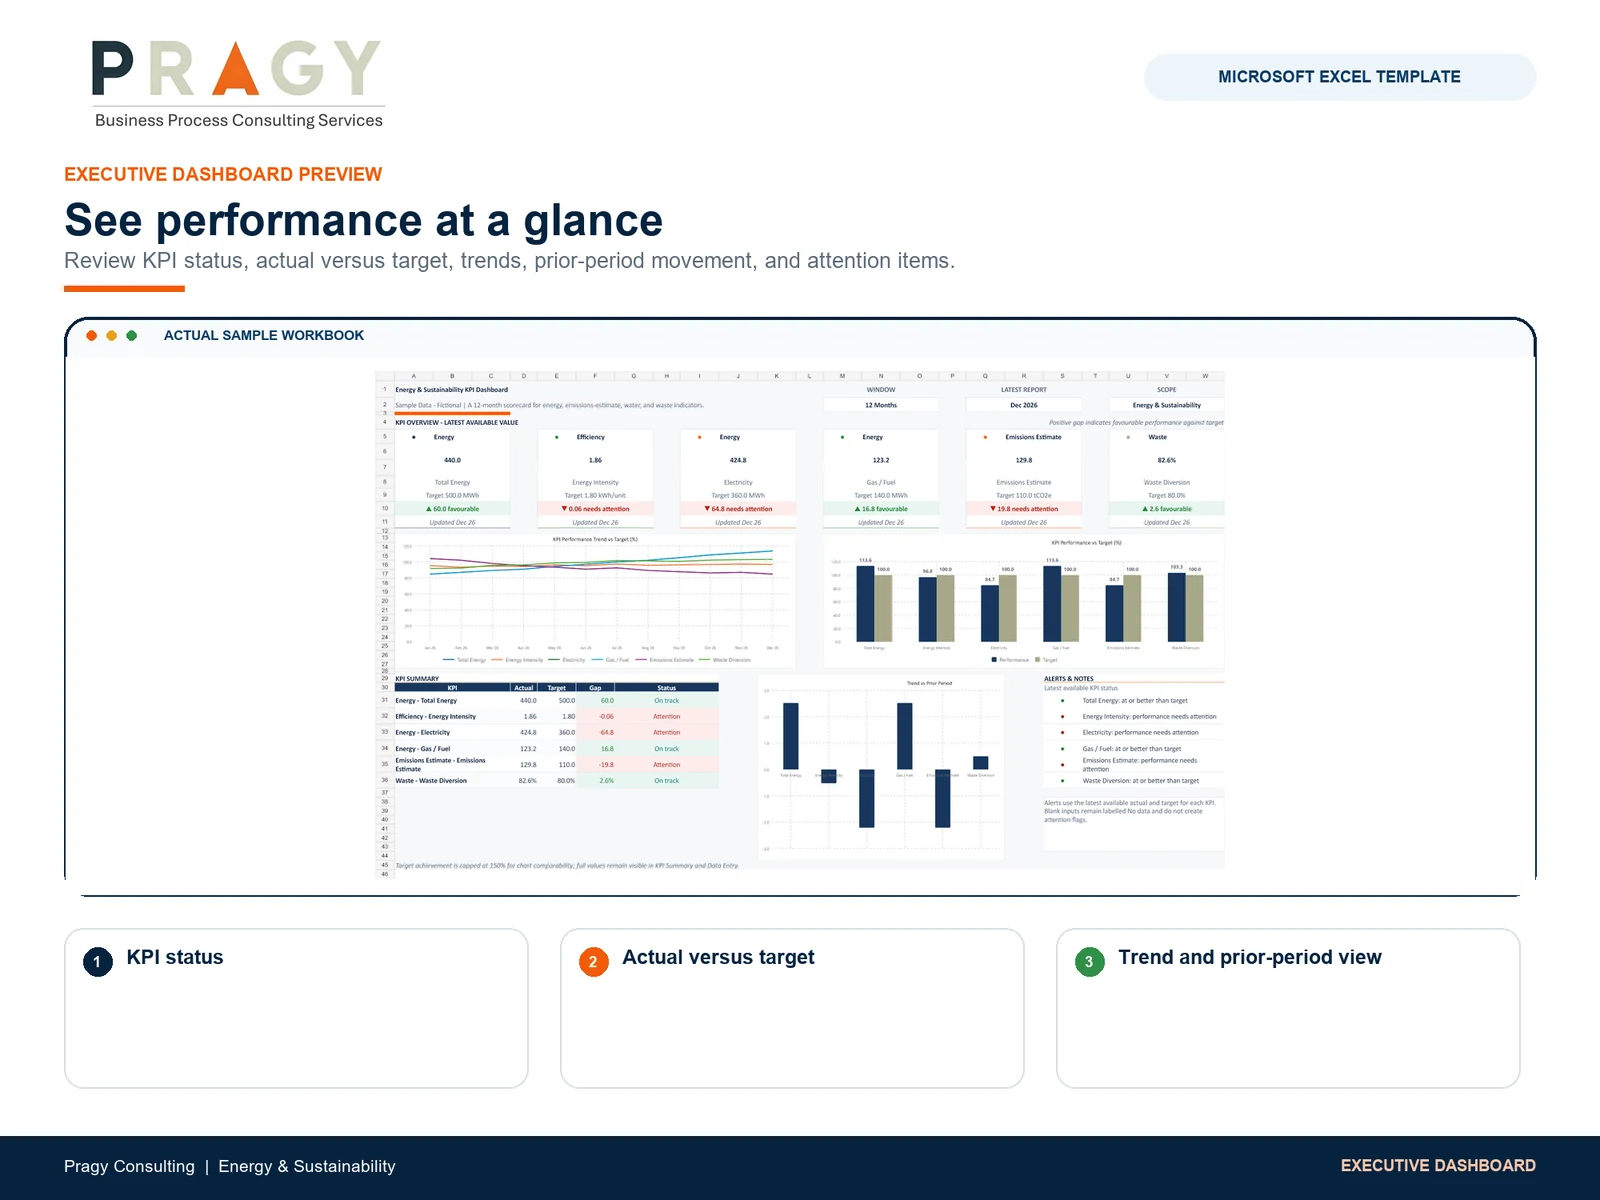
The published package contains two XLSX workbooks: a populated sample and a clean blank. Supporting resources include the Quick Start Guide, KPI Definitions and Examples, Compatibility and Support document, README and selected licence guidance. Data Entry holds supplied monthly values; Executive Dashboard and KPI Trends support the recurring review. The workbooks use formulas and charts without VBA macros.
The six default executive KPIs cover total energy consumption, energy intensity, electricity consumption, natural gas/fuel consumption, Scope 1 and 2 emissions estimate, and waste diversion. Water and renewable-energy measures are wider KPI Library references. They are not additional default executive cards, and editing a library entry alone does not configure corresponding data fields or dashboard charts.
Check Whether the Template Fits
This approach fits a bounded monthly review where a team is willing to prepare validated inputs and maintain an Excel file. The product page states that Excel for Microsoft 365, Excel 2021 and Excel 2024 were tested on documented Windows and Mac configurations. Check those details against the intended environment; rendering can vary. Google Sheets and LibreOffice are unsupported.
Real-time feeds, integrations and multi-site automation require separate scope. Assess this package for internal reporting and decision preparation, with user validation of definitions, formulas and outputs.
Licence and Support Questions Before Buying
The product page offers Single User and Team / Business options. Confirm the appropriate licence for the intended users and use before selecting Add to cart. The option names alone do not establish seat counts, organization coverage or client-sharing rights.
Review the current terms and price on the product page. Advertised digital delivery is a ZIP package after successful checkout, with three downloads available for 30 days through the order email/account flow. Plan where the authorized reporting copy will be maintained.
The Digital Product Terms distinguish standard file-access and documented-compatibility support from separately scoped customization, integration, data cleansing, validation and implementation. Clarify any intended use or support need that the published information does not resolve.
How This Helps Business Leaders
The useful decision is what to investigate next. In the illustration, a leader can acknowledge the smaller electricity total while asking why electricity per defined output unit rose. First confirm a comparable denominator and complete sources. Then assign a specific question about the relevant operating conditions.
A chart can keep both measures in the discussion. The team’s established review and action process supplies the ownership and follow-through. More demanding comparisons may need qualified analysis of product mix, weather or operating conditions.
How Pragy Consulting Can Help
The Energy & Sustainability KPI Dashboard for Excel offers a defined starting point for presenting prepared monthly KPIs. Review the sample, documentation, compatibility and licence details to decide whether it suits the team’s review. Optional dashboard configuration is separately scoped when the reporting structure needs adaptation.
Start with a clear consumption definition and a validated energy intensity measure. Then View the dashboard and choose your licence, selecting the option that fits the intended use.