

Few incidents this month. Are training and safety actions keeping pace?
That question belongs in a plant manager’s monthly review. Incident figures describe an important part of the period. The same meeting also needs a clear view of the training, reporting and follow-through behind the work. A reassuring incident figure can sit beside overdue training or actions that still need attention.
Pragy Consulting’s Health & Safety KPI Dashboard for Excel provides a prepared structure for that discussion. This safety KPI dashboard brings six default measures into a 12-month actual-versus-target review, with a populated sample, a blank workbook and practical guidance. It gives the team a reporting starting point for the monthly inputs they prepare and validate.
Read incident outcomes beside preventive work
OSHA’s Leading Indicators guidance distinguishes measures of past incidents from measures of preventive safety activities and recommends using both. For a monthly review, that means looking at what happened alongside the work being carried out to manage safety.
The dashboard’s six default executive KPIs cover:
- Recordable incident rate.
- Lost-time incident frequency.
- Near-miss reports.
- Safety training completion.
- Corrective-action closure.
- Safety observations completed.
Read these measures together, with their definitions and reporting context. A change in near-miss reports deserves a question about the underlying records. Training completion needs a clear definition of who was due to complete what. Activity totals help direct the discussion; the team’s professional judgment determines what those results mean.
Worked example: prepare the next monthly review
Consider a monthly review where incident measures are within the site’s chosen targets, while training completion and corrective-action closure are below their own targets. The useful question is specific: which outstanding work needs attention before the next review?
Use the workbook’s published preparation sequence to make that discussion concrete:
- Start with the sample and Quick Start Guide. Explore how the populated example connects monthly inputs, target comparisons and trends. Then use the blank XLSX workbook for your own reporting.
- Set the meaning of each measure. Review KPI names, units, direction, targets and definitions. Agree the reporting period, source and responsibility for each input. Prepare incident-rate values through your organization’s approved source process.
- Enter the prepared monthly values. Gather actuals and prior-period values from the team’s records. Check completeness and consistent definitions before entering them in Data Entry. Validate the resulting outputs for your context.
- Review the pattern. Use Executive Dashboard and KPI Trends to compare actuals with targets and examine the period alongside earlier months. Bring the underlying records to questions that need more detail.
In this example, ask which training is outstanding, whether the intended group is included, and which corrective actions need follow-up. Check the relevant training records and action records, then agree an owner and review date in the team’s existing process. Keep that follow-up alongside the dashboard discussion.
Give near-miss reports and observations the same care. If a count changes, ask about reporting coverage, the work undertaken and the records behind it. Avoid treating a lower report count or a higher activity total as a complete verdict on safety. The review should leave the manager with a focused question and an agreed next step.
View the safety dashboard and choose your licence.
What the Excel package gives you
The package includes two Excel workbooks: a populated sample to explore and a clean blank file for your reporting. Customer documentation includes the Quick Start Guide, KPI Definitions and Examples, Compatibility and Support, README and selected-licence guidance.
Data Entry supports preparation of monthly values. KPI Guide provides the place to work with measure definitions, while Executive Dashboard and KPI Trends support the target and trend discussion. Editable KPI fields let you adapt the reporting vocabulary to your organization.
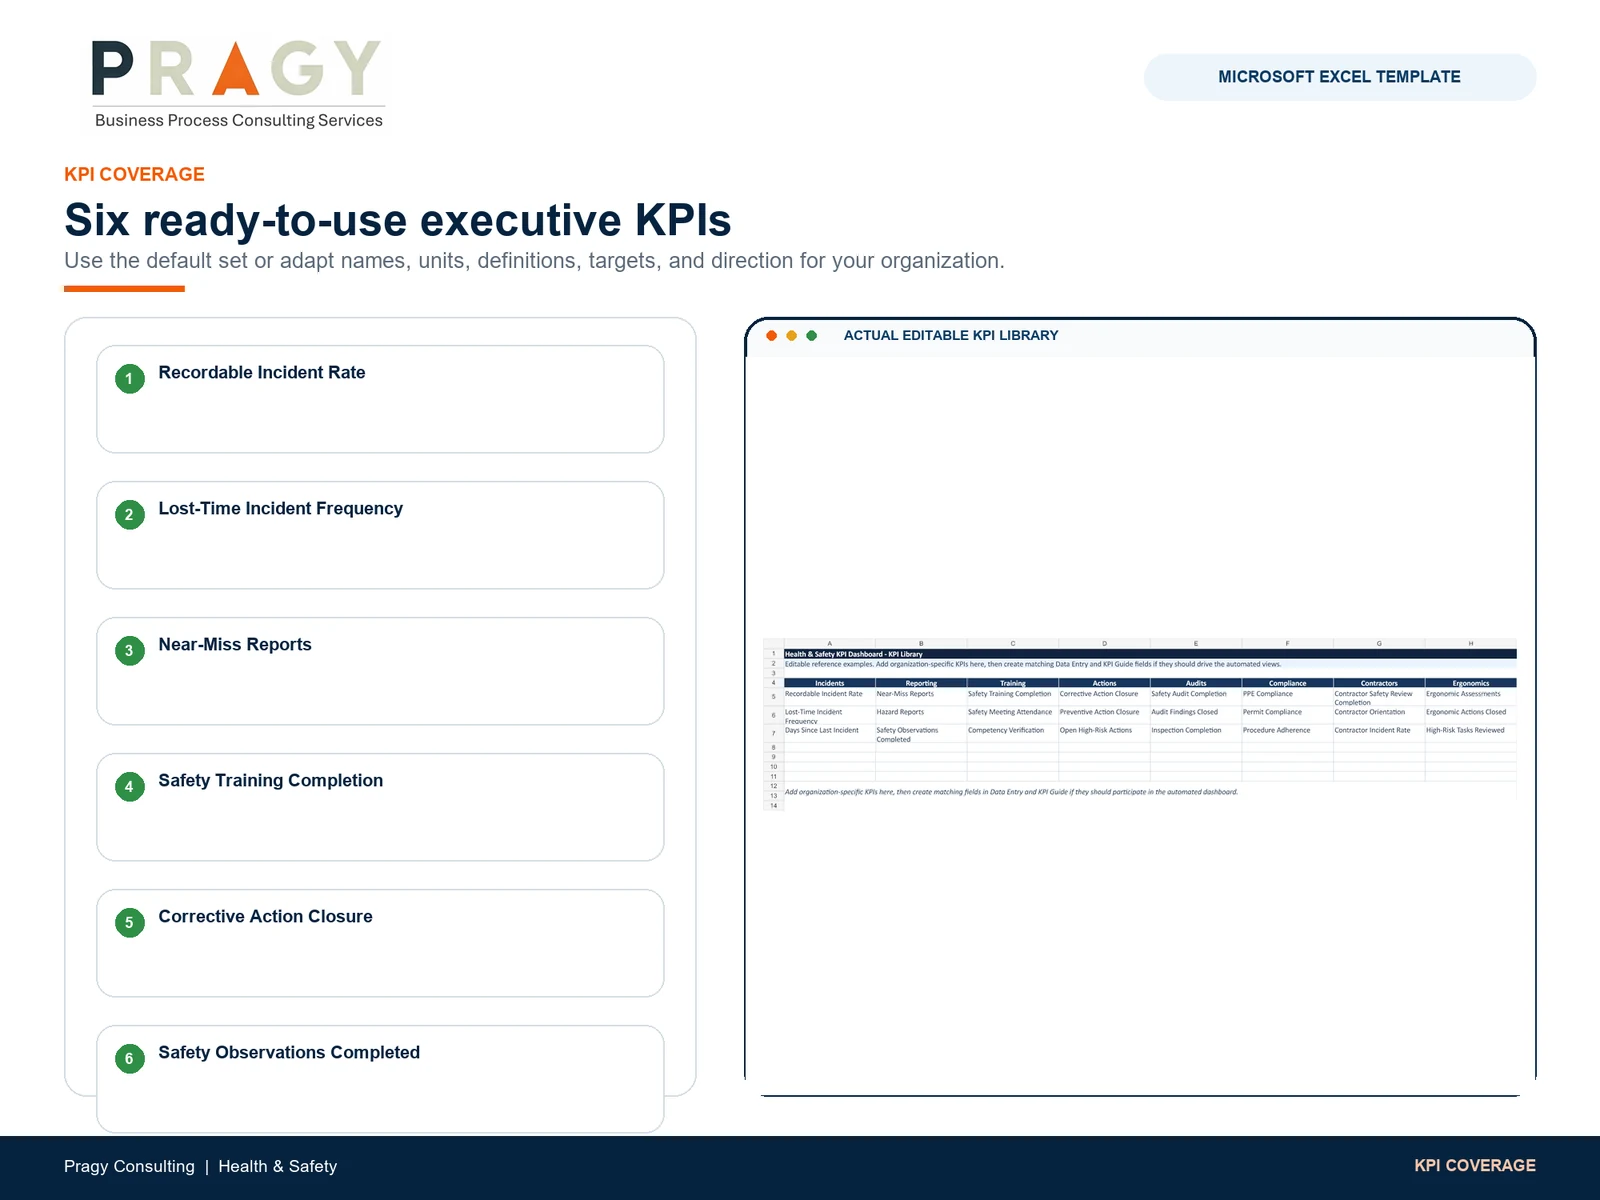
The KPI Library also provides reference entries. If you add an organization-specific KPI, create its matching Data Entry and KPI Guide fields for it to participate in the dashboard views. Plan that setup explicitly when deciding how much adaptation your team needs.
How This Helps Business Leaders
The value is a structured conversation about the month. A plant manager can review incident outcomes, training and follow-through within the same reporting frame, then decide where to ask for detail.
A consistent set of definitions and targets also gives contributors a clearer basis for preparing the next period. The manager can ask what changed, check the source records and carry an agreed question into the next review. Keeping the measures together supports that preparation while the team retains responsibility for safety decisions and the underlying work.
Choose the fit for your team
The formula- and chart-driven XLSX files use no VBA macros. The product page describes testing on documented Windows and Mac configurations of Excel for Microsoft 365, Excel 2021 and Excel 2024. Review those configurations for your setup; Google Sheets and LibreOffice are unsupported.
Choose Single User or Team / Business for your intended users and use, following the included licence and Digital Product Terms. Standard support covers file access and documented compatibility. Configuration, integration and validation services require separate scope. This package fits prepared monthly internal reporting, with users validating definitions, targets and outputs and retaining professional safety judgment.
How Pragy Consulting Can Help
Start with the Health & Safety KPI Dashboard for Excel to establish the reporting structure for your next monthly review. Explore the sample, prepare the blank workbook for your context and use the guides to organize your inputs. If you need help configuring KPIs, targets or the reporting structure, Pragy Consulting also offers separately scoped setup.
See the included resources and current licence options, then choose the package that fits your intended use.