
Functional silos are one of the most common barriers to better business performance. They appear when departments work with their own goals, data, priorities, and processes without enough connection to the wider business system.
In many organizations, the issue is not lack of effort. Sales is working hard. Operations is working hard. Quality, finance, supply chain, planning, procurement, and customer service are all working hard. The problem is that each function may be optimizing its own area while the overall business process remains disconnected.
Dismantling functional silos does not mean removing functional expertise. It means connecting expertise through shared goals, clear processes, common KPIs, reliable dashboards, and practical operating rhythms.
What Functional Silos Look Like in Practice
Functional silos often show up in small but costly ways. A manufacturing team may be focused on production output while quality is focused on deviation reduction. Supply chain may be working to reduce inventory while sales is pushing for faster customer response. Finance may report cost performance after month-end while operations needs earlier visibility to act.
Each function may be doing its job correctly, but the business still experiences delays, rework, conflicting decisions, and unclear ownership.
Common signs of functional silos include:
- Different departments using different versions of the same data.
- Meetings focused on explaining numbers instead of solving problems.
- KPIs that improve in one area while creating pressure in another.
- Slow decisions because ownership crosses multiple teams.
- Manual reporting that depends on spreadsheets, emails, and follow-ups.
- Recurring issues that are discussed often but not permanently resolved.
These issues are common in manufacturing, pharma operations, quality systems, supply chain planning, S&OP, finance reporting, and small business management.
Why Silos Hurt Business Performance
Functional silos create gaps between strategy and execution. Leaders may set business goals, but teams often receive those goals through separate departmental targets. When those targets are not aligned, the organization can unintentionally create friction.
For example, a production team may be measured on output volume, while quality is measured on batch right-first-time, and supply chain is measured on inventory reduction. Without a connected view, the business may produce more, increase quality risk, and still experience material shortages or customer delays.
The problem becomes larger when reporting is also siloed. If each function prepares its own dashboard or spreadsheet, business leaders spend too much time reconciling reports and not enough time improving performance.
Dismantling Functional Silos Starts with Shared Business Outcomes
The first step is to define the business outcomes that matter across functions. These outcomes should be clear enough for every department to understand how their work contributes.
Examples include:
- Improving on-time delivery without increasing quality risk.
- Reducing production losses while maintaining customer service levels.
- Improving forecast accuracy and supply planning stability.
- Reducing deviation closure time in pharma operations.
- Improving cash flow through better inventory and receivables visibility.
Once shared outcomes are defined, departments can align their KPIs around the same business direction. This avoids the common problem of one function “winning” while the overall process continues to struggle.
Use End-to-End Process Thinking
Functional silos usually exist because organizations are structured by department, while value flows across departments. A customer order, production batch, quality investigation, procurement cycle, or S&OP process rarely stays within one team.
End-to-end process thinking helps leaders see how work actually moves through the business. This is where Lean Six Sigma and operational excellence methods are useful. Tools such as SIPOC, value stream mapping, process mapping, root cause analysis, and standard work can help identify handoff gaps and unclear responsibilities.
For example, in a pharma environment, a deviation may involve manufacturing, quality assurance, quality control, engineering, validation, and planning. If each team manages only its part of the process, closure timelines may stretch. A cross-functional process view helps identify delays, duplicate reviews, missing inputs, and decision bottlenecks.
Build KPI Systems That Connect Functions
A strong KPI system does more than track departmental activity. It connects leading and lagging indicators across the business.
For example, an operations dashboard may include production output, downtime, yield, schedule adherence, quality holds, material availability, and open maintenance actions. This gives leaders a more complete view of performance instead of treating every issue as a separate departmental problem.
A connected KPI system should include:
- Shared business-level KPIs for leadership review.
- Function-level KPIs linked to business outcomes.
- Leading indicators that show early risk.
- Clear ownership for each metric.
- Standard definitions for calculations and data sources.
- Review routines that lead to action, not just reporting.
This approach is especially useful for S&OP dashboards, manufacturing analytics, quality reporting, finance performance reviews, and management reporting packs.
Use Power BI to Create One Version of Performance
Power BI can play a major role in dismantling functional silos when it is used as a business intelligence platform, not just a chart-building tool.
Many organizations have useful data in ERP systems, quality systems, planning files, production records, finance reports, and spreadsheets. The challenge is that these data sources are often disconnected. Power BI dashboards can bring relevant data together into a common reporting layer for leadership and functional teams.
Useful Power BI dashboard examples include:
- S&OP dashboards showing demand, supply, inventory, service, and capacity.
- Manufacturing dashboards showing output, downtime, yield, scrap, and schedule adherence.
- Quality dashboards showing deviations, CAPAs, complaints, right-first-time, and closure aging.
- Finance dashboards showing revenue, margin, cost, working capital, and budget variance.
- Executive KPI dashboards showing cross-functional business performance in one view.
The goal is not to overwhelm teams with more reports. The goal is to reduce reporting noise and give leaders reliable visibility into what needs attention.
Create Cross-Functional Operating Rhythms
Dashboards alone do not dismantle silos. Teams need regular routines to review performance, identify risks, assign actions, and follow through.
A practical operating rhythm may include weekly KPI reviews, monthly S&OP meetings, daily operations huddles, quality review boards, or leadership performance reviews. The format depends on the business, but the principles are the same.
Each meeting should have:
- A clear purpose.
- Relevant cross-functional participation.
- A standard dashboard or report.
- Defined decision rights.
- Action tracking with owners and due dates.
- Escalation rules for unresolved issues.
Without this structure, meetings can become status updates. With the right structure, they become a mechanism for better decisions and continuous improvement.
Clarify Ownership at Handoffs
Many silo problems occur at handoffs. A handoff may happen between planning and production, production and quality, sales and supply chain, procurement and finance, or leadership and functional teams.
When handoffs are unclear, issues fall between departments. Each team may believe another team owns the next step. This creates delays, rework, and frustration.
Clear ownership can be improved through RACI matrices, process maps, escalation paths, standard work instructions, and dashboard-driven action logs. These tools help teams agree on who is responsible, who approves, who supports, and who needs to be informed.
How This Helps Business Leaders
Dismantling functional silos gives business leaders a clearer view of performance and risk. Instead of managing through separate departmental reports, leaders can focus on the end-to-end business system.
This helps leaders:
- Make faster decisions using consistent data.
- Reduce time spent reconciling conflicting reports.
- Improve accountability across departments.
- Identify root causes instead of treating symptoms.
- Strengthen S&OP, KPI reviews, and management reporting.
- Improve coordination between operations, quality, finance, supply chain, and commercial teams.
For small and mid-sized businesses, this can be especially valuable. Many growing companies reach a point where informal coordination no longer works. A more structured approach to dashboards, KPIs, and processes helps the business scale with better control.
Practical Steps to Start Dismantling Functional Silos
Organizations do not need to solve everything at once. A practical starting point is to select one important cross-functional process and improve it with focus.
Good starting areas include:
- Monthly performance reporting.
- S&OP or demand and supply planning.
- Production performance review.
- Quality deviation or CAPA management.
- Inventory and service level reporting.
- Finance and operations performance reviews.
For the selected area, leaders can map the current process, define shared KPIs, identify data sources, build a dashboard, and establish a review routine. This creates a working model that can be expanded to other areas.
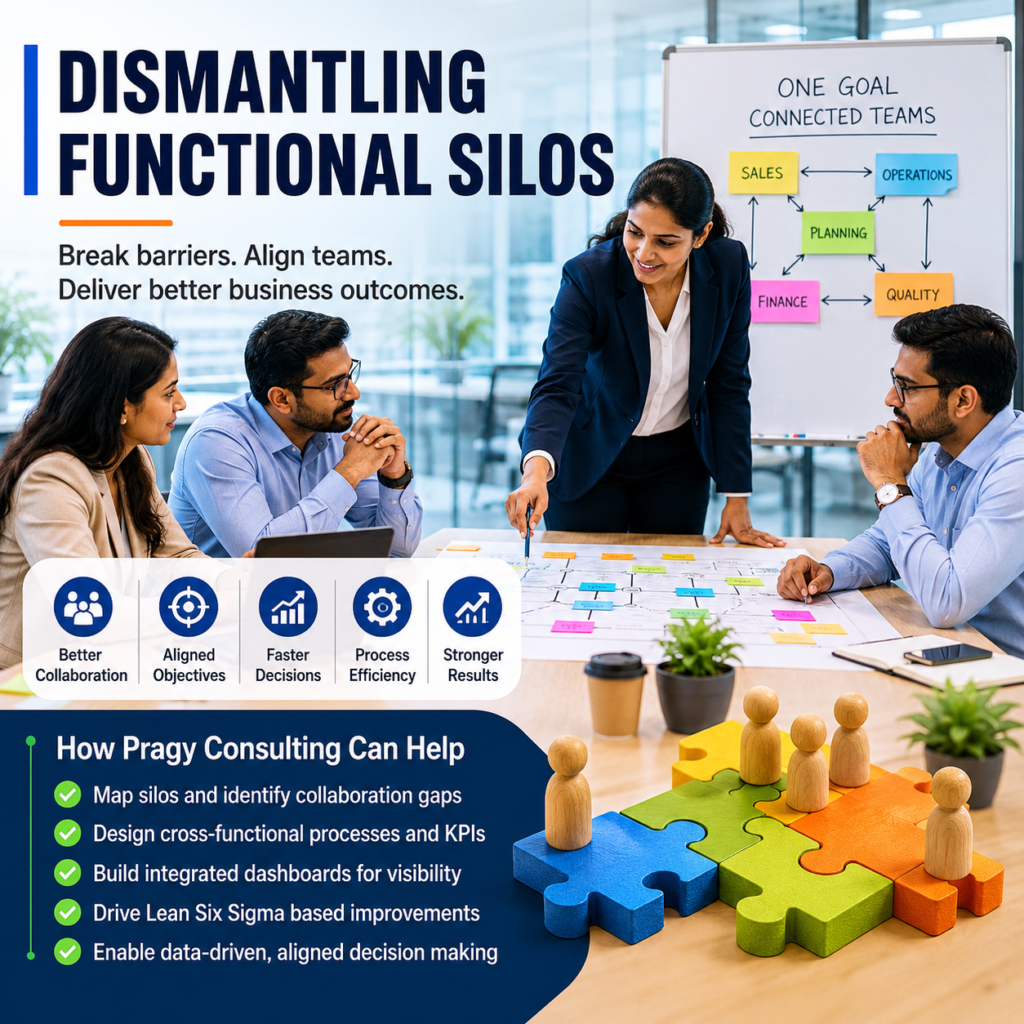
How Pragy Consulting Can Help
Pragy Business Process Consulting Services helps organizations connect people, processes, data, and performance management systems. Our work focuses on practical improvements that business leaders and teams can use in daily operations.
We can support your organization with:
- Power BI dashboard development for cross-functional KPI visibility.
- Business intelligence reporting for operations, finance, quality, and supply chain.
- Lean Six Sigma support to identify root causes and reduce process waste.
- Operational excellence consulting to improve review routines and accountability.
- S&OP dashboards for better demand, supply, inventory, and capacity visibility.
- Manufacturing analytics and pharma operations reporting.
- KPI system design, metric definitions, and management reporting support.
Dismantling functional silos is not only an organizational change topic. It is also a data, process, and performance management challenge. When teams work from shared goals, connected dashboards, and clear operating rhythms, business leaders can make better decisions with less friction.
If your organization is dealing with disconnected reports, unclear accountability, or slow cross-functional decisions, Pragy Business Process Consulting Services can help you build a more connected approach to performance management and process improvement.